
Data Cleaning for Beginners: Excel + Python Step-by-Step (Real Dataset)
Data cleaning means finding and fixing mistakes in data so your decisions can trust it.
We clean one real messy file, a cafe sales sheet, in two ways: Excel with the mouse, and Python with code.
The six dirt types we fix: duplicate rows, extra spaces, mixed capitals, text inside numbers, missing values, and dates stored as text.
Excel is perfect for small one-time fixes. Python is perfect for big or repeating work.
Every screenshot here is from a real session, including one scary error and its simple fix.
Team note: We cleaned this exact file twice before writing this guide. The Excel way took about twenty minutes of mouse clicks. The Python way took seven lines of code and one second. And somewhere in between, our Colab session fell asleep mid-work and threw a scary error at us. We kept that error in the guide on purpose, because real work includes real errors.
What Is Data Cleaning, and Why Should You Care?
Think about making chai. You boil everything together, but before drinking, you strain it. Data works the same way. Raw data is collected messily, and before you analyze it, you strain out the dirt.
Here is why it matters in real money terms. Imagine your price column contains the text “Rs 20” instead of the number 20. Ask Excel for an average and it will quietly ignore those rows, or throw an error. Your “average sale” becomes wrong, and nobody notices until a decision is made on it.
Data cleaning is finding and fixing mistakes in data, so that decisions can trust it.
You need this skill if you are a student doing a project, an analyst preparing a report, a shop owner reading your own sales sheet, or anyone who has ever opened a CSV and felt confused. It is one of the most used real-world data skills, and one of the least taught properly.
Meet Today’s Dataset: Small, Real, and Deliberately Dirty
We are using the sales sheet of our own little example business, Chai & Code Cafe. Eleven rows, five columns, and six planted problems. Small on purpose, so you can see every mistake with your own eyes.
Create a file named chai-cafe-sales.csv and paste this exact content into it:
order_id,date,item,price,customer
1,01-02-2026,masala chai,Rs 20,Riya
2,01-02-2026, Coffee ,Rs 40,Aman
3,02-02-2026,MASALA CHAI,Rs 20,Tara
4,02-02-2026,samosa,Rs 15,
5,03-02-2026,coffee,Rs 40,Dev
6,03-02-2026,masala chai,Rs 20,Riya
6,03-02-2026,masala chai,Rs 20,Riya
7,04-02-2026,  Samosa ,Rs 15,Kabir
8,04-02-2026,coffee,,Aman
9,05-02-2026,masala chai,Rs 20,Tara
10,05-02-2026,coffee,Rs 40,Dev
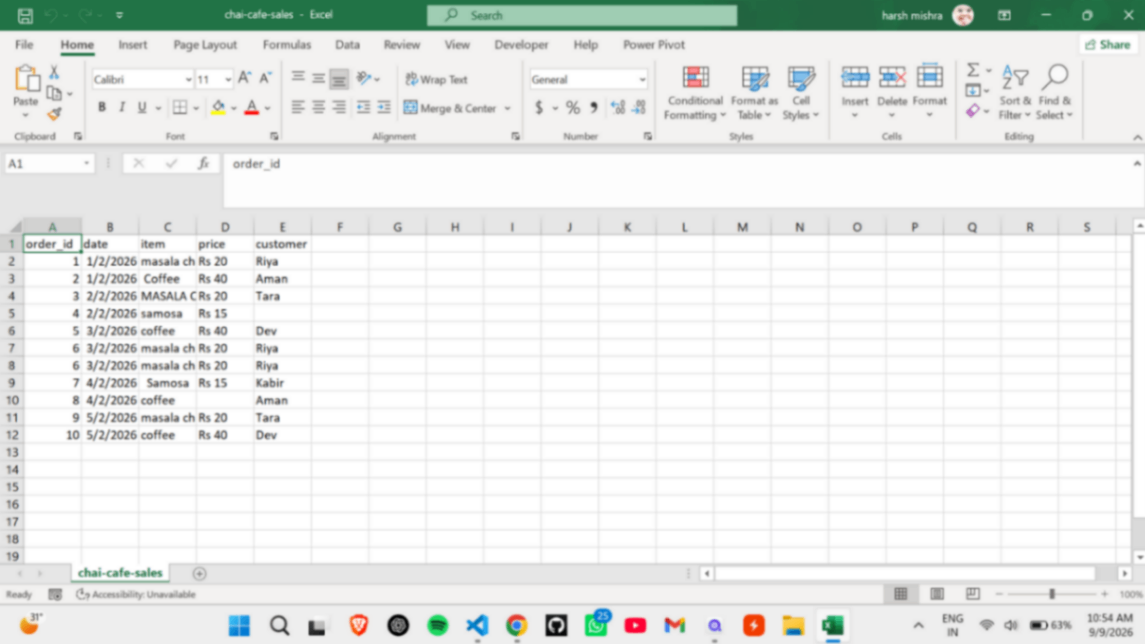
Opened in Excel, this is what the mess looks like:
order_id | date | item | price | customer |
1 | 01-02-2026 | masala chai | Rs 20 | Riya |
2 | 01-02-2026 | Coffee | Rs 40 | Aman |
3 | 02-02-2026 | MASALA CHAI | Rs 20 | Tara |
4 | 02-02-2026 | samosa | Rs 15 | (empty) |
5 | 03-02-2026 | coffee | Rs 40 | Dev |
6 | 03-02-2026 | masala chai | Rs 20 | Riya |
6 | 03-02-2026 | masala chai | Rs 20 | Riya |
7 | 04-02-2026 | Samosa | Rs 15 | Kabir |
8 | 04-02-2026 | coffee | (empty) | Aman |
9 | 05-02-2026 | masala chai | Rs 20 | Tara |
10 | 05-02-2026 | coffee | Rs 40 | Dev |
Now hunt the six problems with us, like a detective checklist:
Duplicate row: order 6 appears twice, identical in every column.
Extra spaces: “ Coffee ” and “ Samosa” hide spaces that break matching later.
Mixed capitals: masala chai, MASALA CHAI, Samosa, samosa — the same item wearing four outfits.
Text inside numbers: “Rs 20” is text, so maths like average and sum will fail or skip it.
Missing values: order 4 has no customer, order 8 has no price.
Dates as text: 01-02-2026 is just a string until we convert it.
Practice beats reading: do not just read this guide. Create the file, make the mess, and clean it yourself. Your hands remember what your eyes only watch.
Part 1: Cleaning in Excel (The Mouse Way)
Excel is a perfectly good cleaning tool for small files, say up to a few thousand rows. Let’s clean our eleven rows the way most offices actually do it.
Step 1: Remove the Duplicate Row
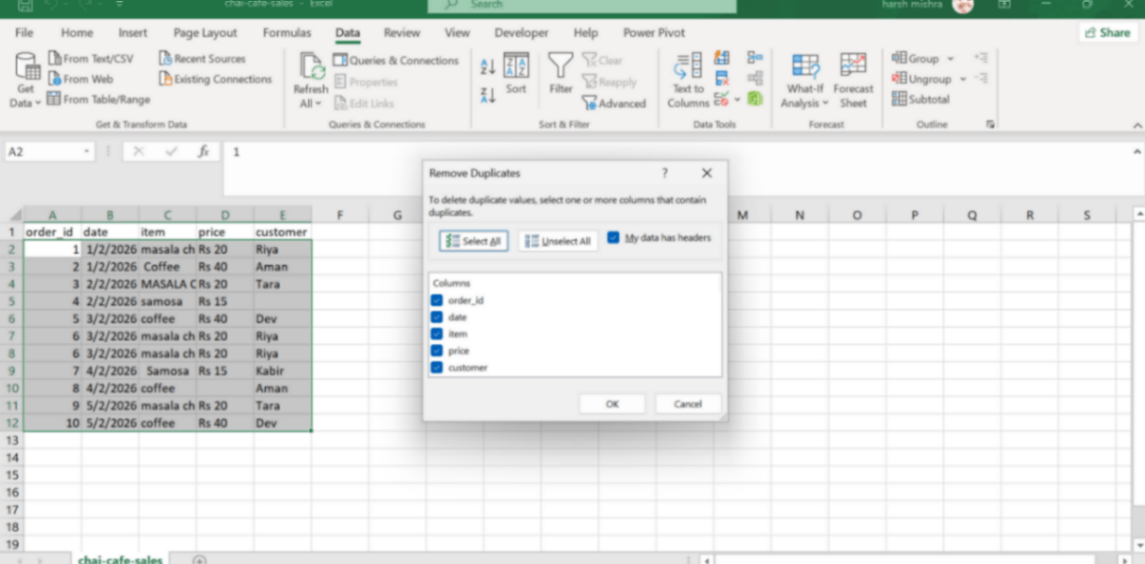
Click any cell inside your data, for example A2
Go to the Data tab in the top ribbon
In the Data Tools group, click Remove Duplicates
In the dialog, keep all columns ticked and keep “My data has headers” ticked
Click OK
“My data has headers” simply tells Excel that row 1 is column names, not data. Forgetting to tick it can make Excel delete your header row as if it were a record.
Excel replies: 1 duplicate values found and removed; 10 unique values remain. That sentence is your first cleaning win.
Step 2: Remove “Rs ” So Prices Become Numbers
Press Ctrl + H to open Find and Replace
In “Find what”, type Rs — yes, with one space after Rs
Leave “Replace with” completely empty
Click Replace All
The space matters: if you search “Rs” without the space, you can accidentally glue words elsewhere. Cleaning is mostly about being precise with tiny things.
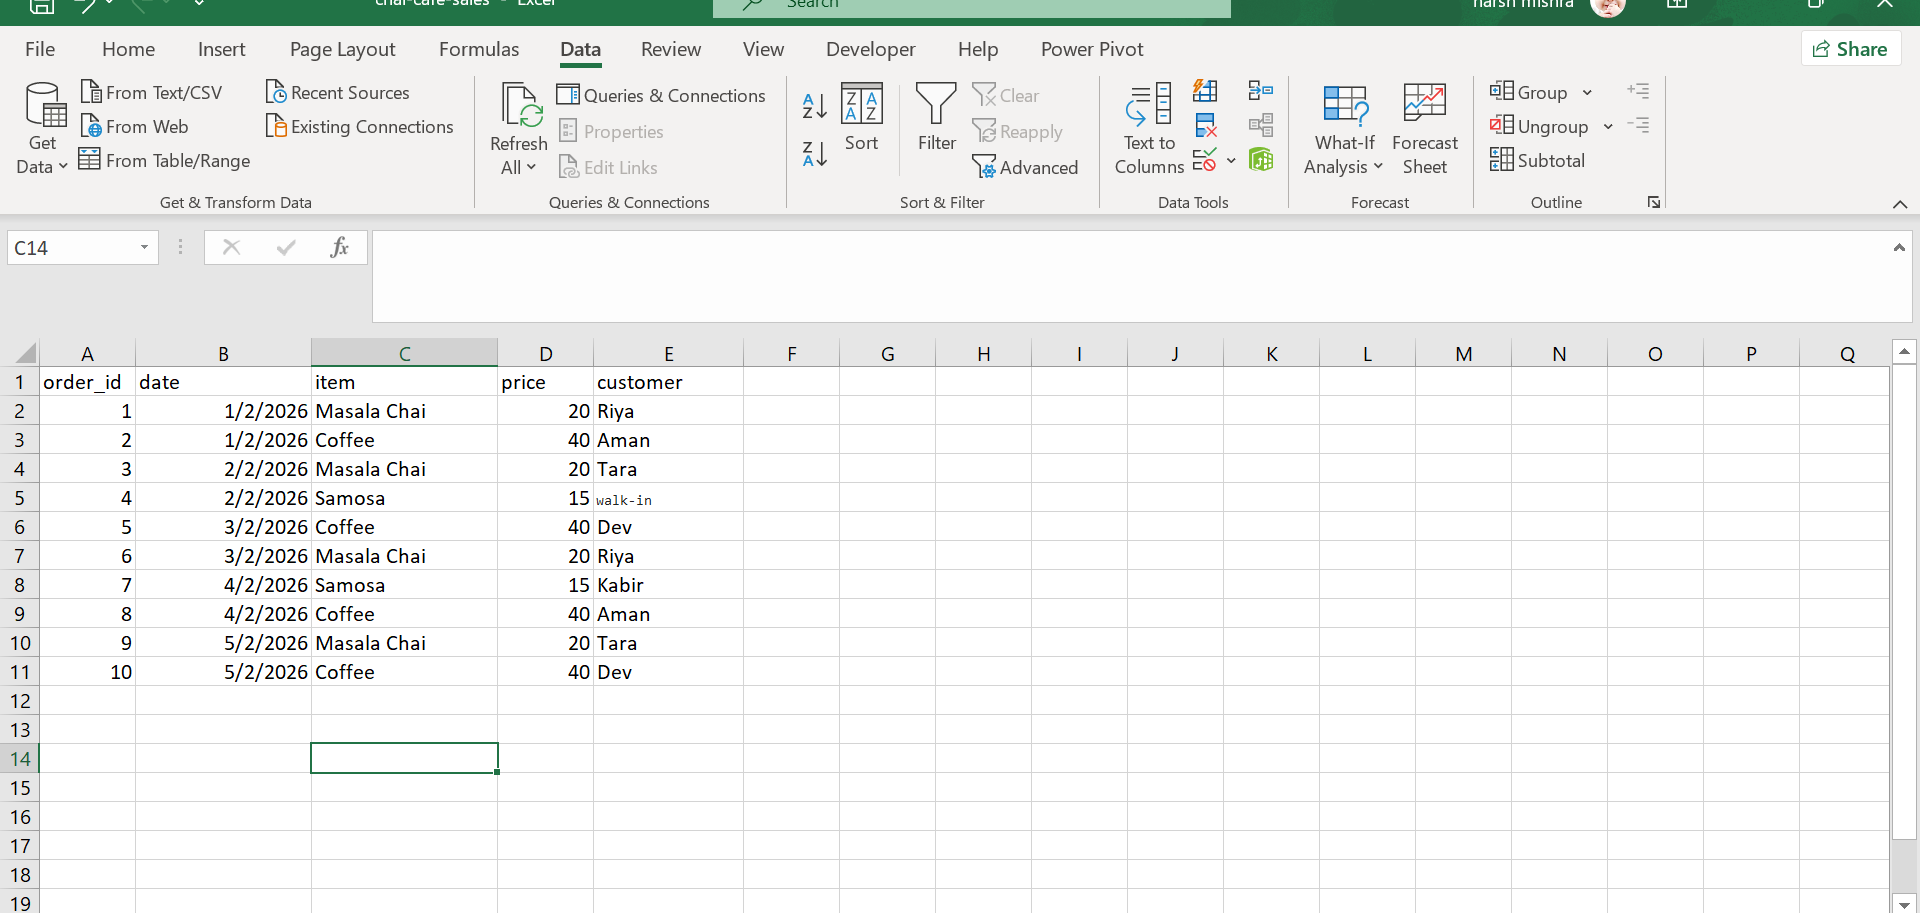
Now the price column holds plain numbers. Try =AVERAGE(D2:D11) now and it will actually work. Before this step, it would have ignored every row.
Step 3: Fill the Missing Values — But Think First
Missing data is not automatically an error. It is a decision. You either delete the row, or fill it with a sensible value, and you should know why you chose either.
Order 8 has no price, but we know coffee costs 40 on our menu, so we fill 40.
Order 4 has no customer name, and walk-in customers often skip it, so we fill Walk-in.
Never silently invent data: if you cannot justify a fill value from real knowledge, deleting the row or marking it unknown is more honest than guessing a number that will later look like truth.
Step 4: Fix the Item Names
With eleven rows, typing the clean names by hand is the fastest and safest option: Masala Chai, Coffee, Samosa. Done.
But with ten thousand rows, you would use a formula instead. In a helper column, write:
=PROPER(TRIM(C2))
TRIM cuts the hidden spaces at the ends. PROPER converts any capital style into Title Case. Drag the fill handle down, copy the results, and paste them as values over the original column.
Step 5: Save a Clean Copy, Never Overwrite the Mess
Use File → Save As and save with a new name, like chai-cafe-sales-excel-clean.csv (CSV UTF-8). Keep the original messy file untouched.
Learned the hard way: during our own run, Excel quietly saved over the messy original while we were practicing. We had to recreate the messy file from scratch. Keep raw and clean files separate, always. Future you will say thanks.
What Excel Taught Us: Problem → Tool Map
Problem | Excel Tool |
Duplicate row | Data → Remove Duplicates |
“Rs ” text in numbers | Ctrl + H Find & Replace |
Missing values | A justified typed value (a decision, not a guess) |
Messy names | Hand-typing for small data, PROPER + TRIM for big data |
Dates as text | Left for Python, on purpose |
The Excel way is done, and honestly, for a small sheet it is enough. But now imagine this same cleaning every morning, on fifty thousand rows, from twelve different branches. Mouse clicks do not scale. Code does. That is exactly where Part 2 begins: the same seven fixes, in seven lines of Python, in one second, repeatable forever.
Part 2: Cleaning with Python (The Code Way)
Now the same job, but with code. We use pandas, the Python library built for table data, inside Google Colab, which runs Python in your browser with zero installation. If your laptop can open Chrome, it can run pandas.
Go to colab.research.google.com, create a new notebook, and upload the original messy file chai-cafe-sales.csv using the folder icon on the left. Not the Excel-clean one. The messy one. Python deserves the real challenge.
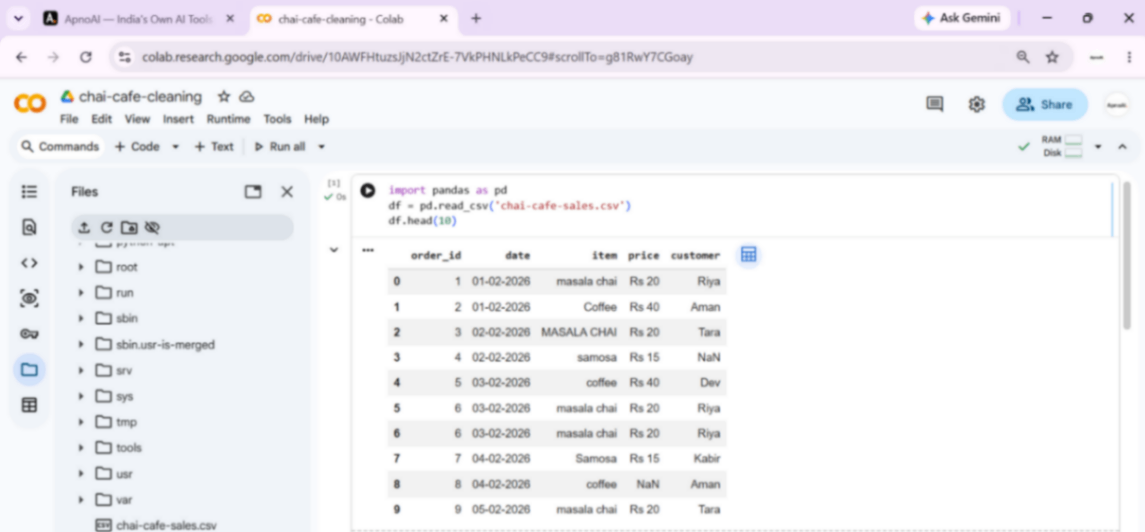
Cell 1: Look at the Data First
import pandas as pd
df = pd.read_csv('chai-cafe-sales.csv')
df.head(10)
Three lines: import the library, read the file into a dataframe (a table in memory), and show the first ten rows. Always look before you clean. Cleaning blind is how good data dies.
In the output you will see NaN where cells were empty. NaN simply means “missing value”. It is not an error, it is pandas honestly telling you “I found nothing here”.
Cell 2: Count the Duplicates
df.duplicated().sum()
The output prints np.int64(1). Ignore the wrapper text; the answer is 1. One duplicate row, exactly what our eyes found in Excel. Code confirms, code does not assume.
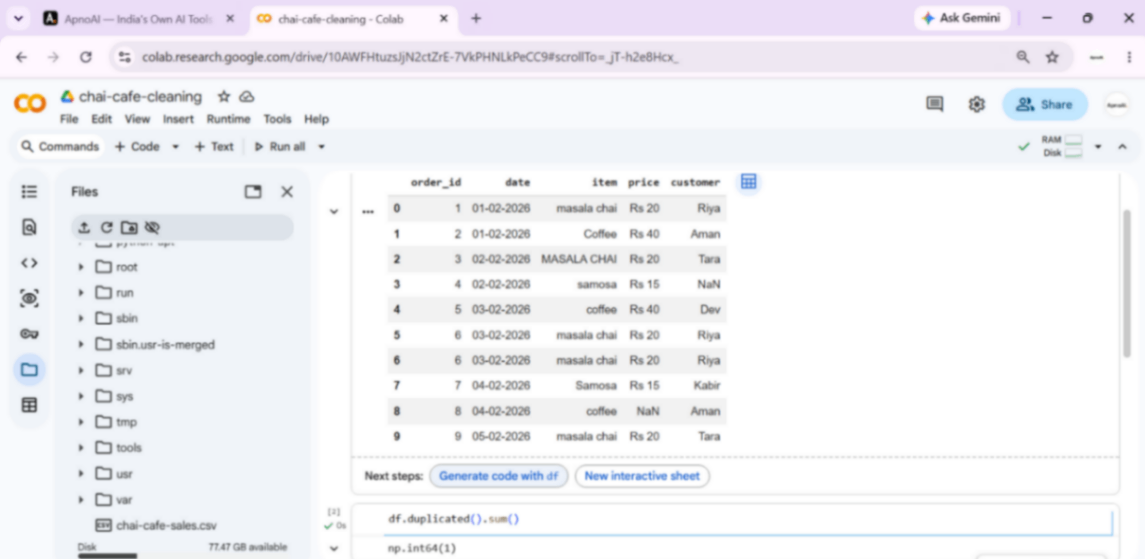
Cell 3: The Seven-Line Cleaning Script
df = df.drop_duplicates()
df['item'] = df['item'].str.strip().str.title()
df['price'] = df['price'].astype(str).str.replace('Rs ', '', regex=False)
df['price'] = pd.to_numeric(df['price'], errors='coerce')
df['price'] = df['price'].fillna(40)
df['customer'] = df['customer'].fillna('Walk-in')
df['date'] = pd.to_datetime(df['date'], format='%d-%m-%Y')
Run it and… nothing prints. No output at all. Beginners panic here, but silence is success: this cell changes data, it does not display it. Here is what each line did, in plain words:
Code Line | Plain Meaning |
drop_duplicates() | Delete rows that repeat exactly |
str.strip().str.title() | Cut end spaces, then fix capitals to Title Case |
str.replace('Rs ', '') | Remove the “Rs ” text from prices |
pd.to_numeric(errors='coerce') | Turn text into real numbers; unfixable becomes NaN |
fillna(40) | Fill missing price with the known menu price |
fillna('Walk-in') | Fill missing customer with a justified label |
pd.to_datetime(format=...) | Convert text dates into real date values |
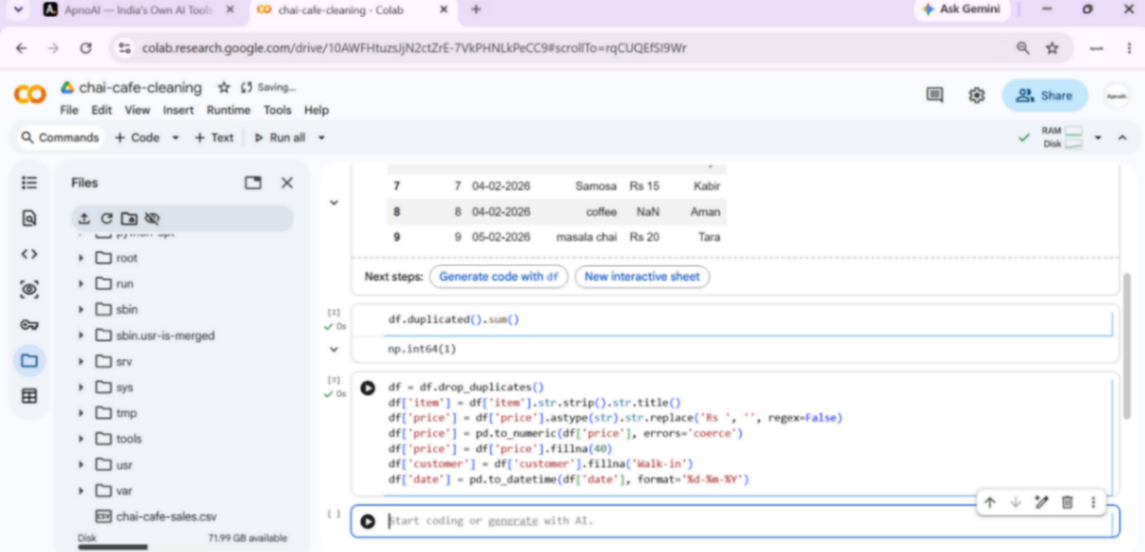
The real error we got, and its two-click fix: mid-session, our Colab runtime fell asleep and Cell 4 crashed with a scary “ModuleNotFoundError” about pandas. Our heart rate went up for no reason. The fix was simply Runtime → Run all, which reconnects and reruns every cell in order. If you ever see a sudden weird error in Colab after leaving the tab idle, restart and run all before doubting your code.
Cell 4: See the Clean Data and Save It
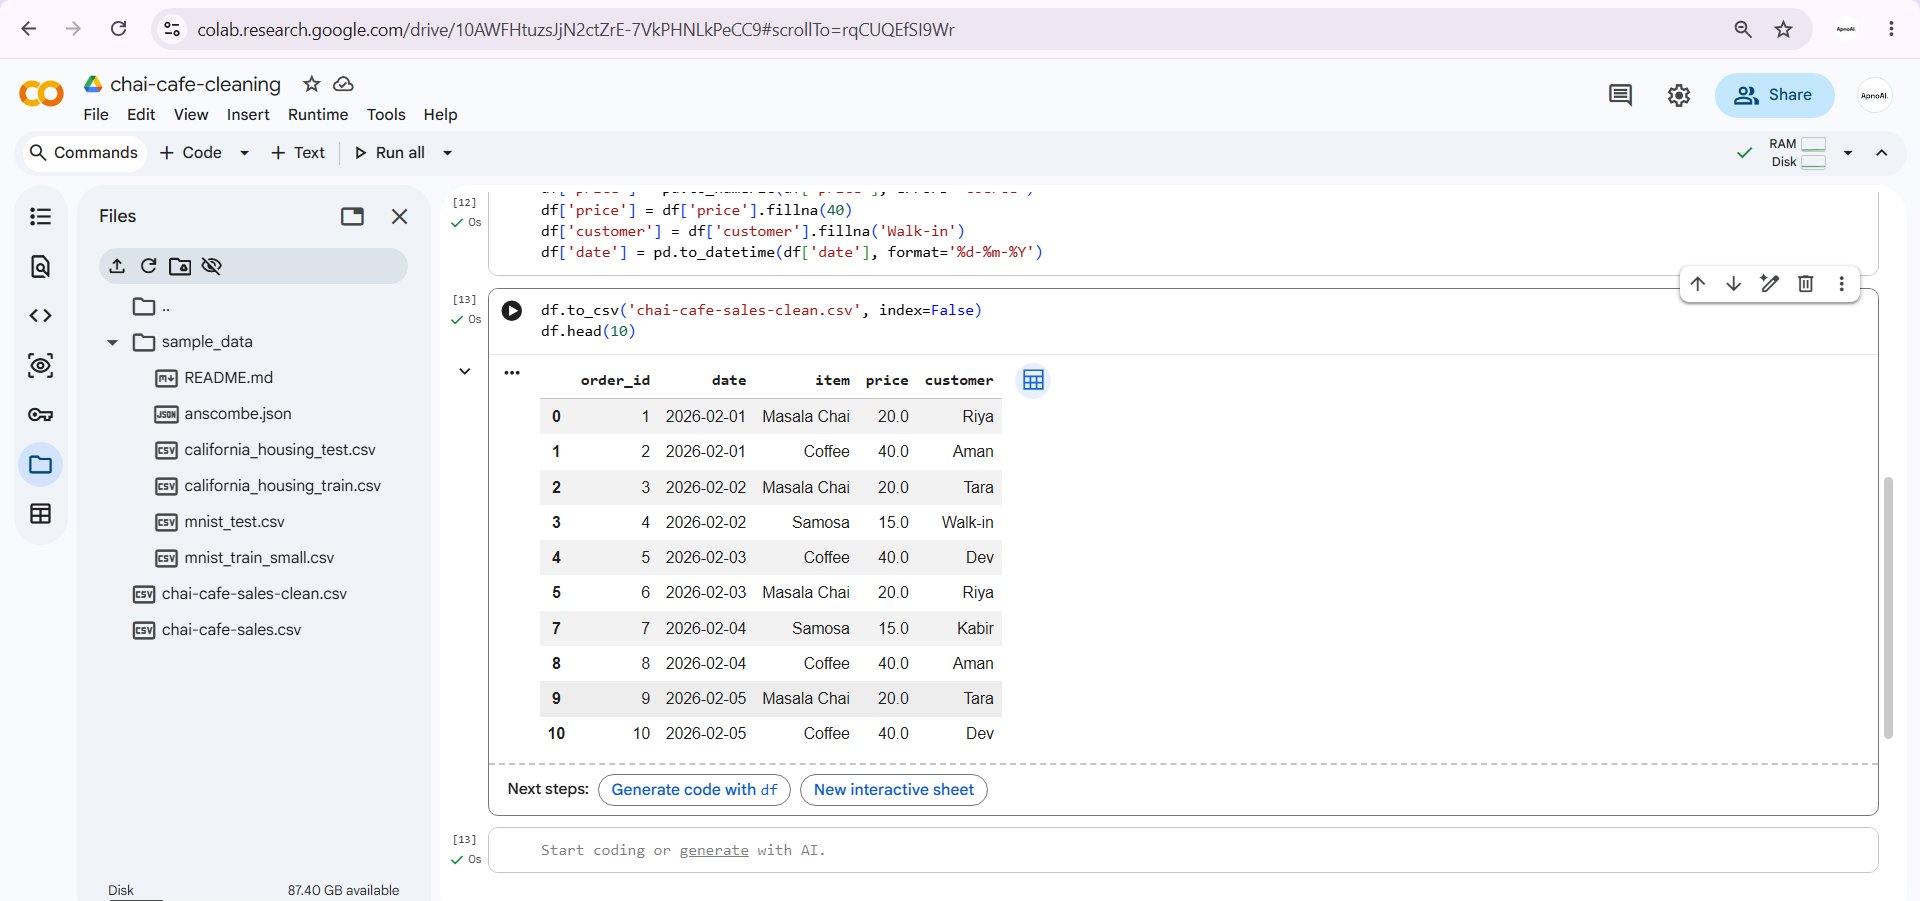
df.to_csv('chai-cafe-sales-clean.csv', index=False)
df.head(10)
Now look at the output table like a detective again, and notice the proof:
The row numbers skip 6, because the duplicate row is gone
Prices show as 20.0 and 40.0 — real numbers now (the .0 just means float format)
Items read Masala Chai, Coffee, Samosa — one outfit each
The missing customer now says Walk-in
Dates read 2026-02-01, a proper date format
The first line also wrote a new file, chai-cafe-sales-clean.csv, into your Colab session. Download it from the folder panel, and you now own a clean dataset produced by your own script.

Excel vs Python: Same Job, Two Tools
Cleaning Task | Excel Way | Python Way |
Duplicates | Data → Remove Duplicates | df.drop_duplicates() |
“Rs ” text | Ctrl + H Replace All | str.replace + to_numeric |
Missing values | Type a justified value | fillna with a justified value |
Messy names | PROPER + TRIM formula | strip + title |
Tomorrow, same file again | Repeat every click by hand | Run the same script, one second |
Neither tool wins everywhere. Excel wins for quick, visual, one-time fixes and for sharing with non-technical teammates. Python wins for repetition, scale, and auditability, because a script is a written record of every decision you made.
The walk-in story: compare the two clean files and you will find a tiny difference. Excel has “walk-in”, Python has “Walk-in”. One letter, different capital. This is exactly how real datasets get polluted across teams, and why data teams write down naming rules. Spotting this yourself is a real analyst skill.
Beginner Mistakes We Made, So You Skip Them
Mistake | What Happens | Fix |
Saving over the raw file | Original mess is lost forever | Always Save As a new clean name |
Searching “Rs” without the space | Wrong text gets glued or cut | Type the space, preview with Find First |
Unticking “My data has headers” | Header row gets deleted as data | Keep it ticked when row 1 is names |
Panicking at NaN | Wasted time fearing an error | NaN just means missing; decide, don’t panic |
Panicking at a sleeping Colab runtime | Weird ModuleNotFoundError appears | Runtime → Run all, or Restart and run all |
Filling missing values with guesses | Fake numbers enter your analysis | Fill only from real knowledge, else mark unknown |
Your Data Cleaning Roadmap (Use It on Any Dataset)
Memorize this order and you can walk into any messy CSV, in any job, and know exactly what to do first:
Look First
Open and view the data before touching it.
Count Duplicates
Know how many repeats exist.
Fix Text
Trim spaces, unify capitals.
Fix Numbers
Remove text, convert to numeric.
Decide Missing
Fill with reason, or remove.
Fix Dates
Convert text to real dates.
Save Clean Copy
New name, raw file untouched.
Data cleaning is straining before drinking: fix mistakes before you analyze.
The six common dirt types: duplicates, spaces, mixed capitals, text in numbers, missing values, text dates.
Excel is ideal for small one-time cleaning; Python is ideal for repeatable and large cleaning.
Missing data is a decision, not an automatic fix. Never invent numbers silently.
NaN and np.int64 wrappers are not errors; they are pandas speaking its dialect.
A sleeping Colab runtime causes scary errors; Run all fixes most of them.
Always keep the raw file untouched and save cleaning results as a new file.
Small inconsistencies like walk-in vs Walk-in are how real data gets polluted; naming rules prevent it.
Conclusion
You started with eleven messy rows and ended with two clean files, one made by mouse and one made by code. On the way you removed a duplicate, rescued numbers trapped inside text, made two honest decisions about missing data, and survived a real Colab error.
That is not tutorial knowledge. That is working knowledge. The next time someone hands you a dirty CSV at college, at work, or in an interview take-home task, you will not stare at it helpless. You will look first, count duplicates, fix text, fix numbers, decide missing, fix dates, and save a clean copy.
Clean data is not a technical skill. It is a habit of respecting the truth inside your numbers.
Practice this once more on any dataset you find, and data cleaning stops being a chore and becomes your superpower. Because everyone wants to build models and dashboards, but very few people are willing to clean the data first. Be the one who is willing.
Thank you for cleaning with us. If this guide saved you from a messy spreadsheet at 2 AM, share it with a friend who is fighting one right now. — Harsh Mishra, APNOAI Team
.jpeg)